Databases
Introduction
When the use of a database was first introduced into the requirements for IA a lot of physics teachers didn't know what it meant. In physics we generally are looking at the relationship between two quantities (Extension and load, heat and temperature, distance and time etc.) and you don't need a database to deal with these relationships. Databases are used when there is a lot of connected data. Its always dangerous to use examples from other subjects but I guess that an biologist might collect data about the different plants, weather, soil type, insects, use of pesticides and bird life at different locations. By putting the data into a database they would be able to look for possible connections between e.g. type of plant and rainfall, physicists don't tend to work this way except maybe in astrophysics. So it's not easy to think of examples of databases to use with our students however I did think of these 4 which were posted on the ICT and IB physics website.
Plotting the BE curve
The example I have used is to use a database of nuclear masses to calculate the BE per unit mass of a selection of different isotopes to plot the BE curve. This is stretching the term "database" a bit since although the data is coming from a database it is not being used to look at relationships, however it gets the box ticked and is a very useful exercise as it helps the students to really understand where that curve is coming from.
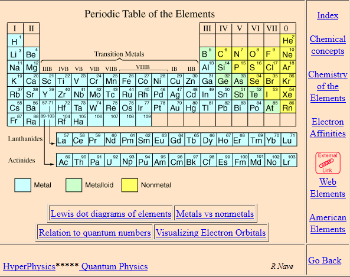
The database I use is the Hyperphysics periodic table of elements . After we have covered BE in class, with a couple of examples of how it is calculated, I point my students at this website and ask them to plot a graph of BE/A against A. They have to work out for themselves how to process the data in excel but by this time they have used excel quite a lot to manipulate data so manage to do it without too much help.
Kepler's 3rd law
This is example uses a database containing information about the planets to plot a graph of time period 2 against radius3. I have used this one too but there isn't so much to be gained from the exercise so I don't bother with it any more.
Ice cores
This seemed like quite a nice idea at the time since it uses data that is posted on the net by different researchers around the globe. This gives the students an idea of scientists being part of an international community. Using this data it is possible to look at all sorts of different relationships however the data isn't really in a database, its simply a lot of text files. This makes it quite difficult to analyse and most students don't get as far as drawing a graph.
Statistical Review of Energy 2009
This is how a database is supposed to be used rather than the way a physics teacher wants to use one to emphasise a bit of physics theory. The website includes a neat little tool called the energy charting tool. Using this it is possible to plot charts showing consumption of different types of fuel in different countries over the past 45 years. Thanks to a very user friendly interface this doesn't take very long but could be used by students to help gather data ready for a presentation on energy use.