Kettle simulation (Excel)
Introduction
In this exercise the heating of a kettle will be modeled by building up a spreadsheet in Excel, starting with a simple no heat loss model then adding complexity by considering the heat given to the kettle then heat loss. This worksheet is written for student who have already grasped the basics of using Excel so should know how to add formula, insert graphs and use sliders. If you have done Projectiles in excel then you will have the required skills.
No heat loss
The relationship between the heat, Q added to a mass, m of water and the temperature increase ΔT is given by the equation

So if the power of the kettle is P and then in a time Δt the increase in temperature will be

The first thing to do is to set up a table with some values in it, these will be used in the equations. Put this table somewhere to the left of the spreadsheet, I used columns K and L, if you use the same then your equations will be the same as mine.

- Now add a column for time, this starts with 0 then rises by the time increment. To do this add the formula =A2+L$4 and copy it down for 100 rows
- The temperature will be calculated for each step in time but first add the initial temp =L$5 to the first row
- the temperature after 1s will be the original temperature + the increase in temperature =B2+(L$3*L$4)/(L$6*4200). Add this formula and copy it down
- Insert a scatter chart to display the change of temperature with time.

Try adjusting the values of power and mass of water to see what happens to the graph.
Note that the model doesn't take into account the fact that water boils at 100 °C however you can set the y axis so temperatures above 100 °C are not displayed.
Heat to the kettle
In reality heat will be given to the kettle itself as well as the water inside it, if the heat capacity of the kettle is C then the equation becomes:

So

- Add a value for the heat capacity to your table of values (say 1000 JK-1) and adjust the formula calculating ΔT accordingly.
Heat loss
If an amount of heat h is lost for each increment of time then the equation becomes

So the temperature change will be

Heat loss is related to the difference between the temperature of the water and the room. If we assume that they are directly proportional then

where k is some constant, the "heat loss constant"
- add the heat loss constant (20) to your table of values
- add the room temperature (20) to your table of values
- adjust your equation to take into account the heat loss (use the previous temperature as the water temp)
Try adjusting the heat loss constant and room temp. to see what happens.
- Add sliders to make adjusting all the variables easier.
To add sliders so you will need to make sure that you have the “developer tools” available. To do this, open excel and click file > options > customize ribbon > tick developer in the right hand box. You will now see the developer tab on the ribbon at the top.
Adding the Developer tools
Right click the menu bar with tabs like Home and Insert on it

Choose Customize quick access toolbar
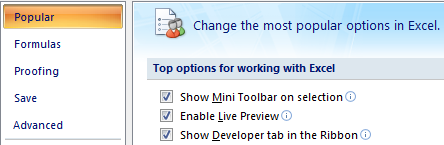
Choose Popular then tick the box “show developer tab in ribbon”
Note that not all versions of excel are the same but the process is similar.
Adding the slider
To add a slider open the developer tab and insert slider (its actually called a scroll bar) from the active x options.

Insert the slider next to the value.
To set the sliders properties right click it and select properties. If this doesn’t work you might need to click “design mode” in the developer tab.
Link your slider to the relevant cell and set reasonable min and max values.

Try sliding the slider to see if the values change.
Your final spreadsheet should look something like this