Human Development - Exploration marks
Investigating the Human Development Index (HDI).
Mark 15/20
 This Project serves to highlight the below differences between a 'Project' and an 'Exploration'.
C - Personal Engagement and the Projects criterion B - Information/Measurement
Issues pertaining to data collection alone are unlikely to carry sufficient weight to provide evidence for ‘outstanding’ personal engagement. This would require other elements e.g. thinking independently and creatively as to the data that would be needed, or the statistical methods required, to meet the exploration’s aims and goals
D - Reflection
Neither ‘critical’ reflection nor ‘substantial evidence’ really form part of the Project’s criterion D descriptors. It is therefore to be expected that current Projects, written with the Project criterion in mind, will not reach achievement level 3 using the exploration criteria (but will be able to, once this is included in the student's preparation for the internal assessment).
E – Use of mathematics
In a statistical/modelling exploration, if the data, when plotted on a scatter graph, looks non-linear, it is expected that the student would not use ‘r’ nor linear regression. They would be expected to find an appropriate non-linear function from the syllabus (or beyond/commensurate with it) to model the data. This is a significant departure from the project where there is not an expectation on student’s to find an appropriate non-linear model using their functions knowledge.
View the project ![]() Human Development Index
Human Development Index
The marks explained
Criterion | Name | Mark | Justification |
A | Presentation (4) | 3 | The body of the work makes the aim/focus of the work on the influence of GNI on HDI measures clear, but the introduction does not. Moreover, there is little/no explanation for what, why and how the student has produced the tables on p.2 of the work. Other than these two points, the work is well organised and coherent and reads easily. |
B | Mathematical Communication (4) | 4 | Multiple forms of mathematical representation: tables, graphs, formulae etc. are used. The notation is correct throughout and the graphs correctly labelled with units and scale (the student has correctly removed the y-axes from the boxplots) The TSM section on ‘Preparing for the internal assessment’ reminds us that this criterion includes “expressing results to an appropriate degree of accuracy”, which the student does on p.6 in their discussion of using non-rounded figures in the calculations, but then rounding to two d.p. when quoting the final statistic (as they have also done for the means and standard deviation when summarised, to 3 d.p. in the tables on p.3). The choice of 2 d.p. for ‘r’ and 3 d.p. for the HDI means and standard deviation by continent on p.2 could have been explained, but there is sufficient evidence to support B4 rather than B3. |
C | Personal Engagement (3) | 2 | The student has carefully selected large data sets and for suitable and pertinent indicators, given the aim of testing if HDI is too heavily influenced by income to be an accurate indicator of development. There is evidence of meaningful reflection throughout that seems to drive the exploration forward and help the reader to better understand the writer’s intentions. However, a fairly standard approach to analysing these questions has been taken, which doesn’t provide sufficient evidence of the ‘quality’ and ‘creativity’ that might be expected as evidence for outstanding personal engagement.e.g. researching and using an alternative method of ‘goodness of fit’ given a non-linear relationship in the scatter graphs, developing a little further analysis on an alternative factor influencing HDI e.g. inequality (made reference to, but not analysed/developed, by the student). |
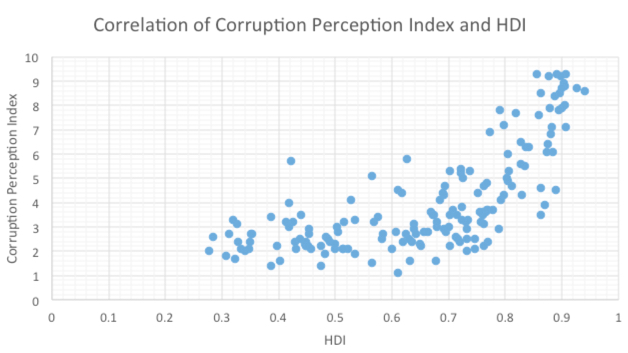
D | Reflection (3) | 2 | There are examples of critical reflection in the student’s work (see annotations directly on the work e.g. sample size consideration when comparing standard deviations of south America and Europe). However, there are also serious omissions in the students reflections on the scatter graph interpretations for CPI and GNI. For example, on p.6 the GNI scatter graph is the second indicator (CPI being the first) for which the student hasn’t realise that it appears to show two different relations, for different HDI levels. The lack of an attempt to model the data using functions is penalised under criterion E (and therefore, not considered here). |
E SL | Use of Mathematics (6) | 4 | On p.5 to 7, it is clear from the CPI and GNI scatter graphs that the relationships are not linear. The student should have spotted this and taken the time to find an appropriate model rather than calculating ‘r’ (maybe using SSE instead etc.). The calculations undertaken are correct, but this incorrect use of ‘r’ renders much of this section of the exploration’s analysis invalid. Regrettably, for this reason, ‘some’, rather than ‘good’, knowledge and understanding is a better fit description of the work. |
E HL | Use of Mathematics (6) | 2 | The mathematics used is not commensurate with the level of the course, but is relevant, with some understanding and knowledge demonstrated. |