Mixing our models
Wednesday 12 May 2021
 A question about this PhET waves simulation made me think about how are use of analogies and models can sometimes confuse rather than clarify. Don't get me wrong, this is a great simulation but maybe there is too much going on.
When representing light the wave is shown as well as a screen, the screen shows what we see, the wave is our physical model used to explain what we see. The colour seen on the screen is related to the wavelength but why is the wave green?
The intensity of the light is related to the amplitude but in the simulation it is also represented by the brightness of the wavefronts. Waves don't have brightness and colour they have wavelength and amplitude.
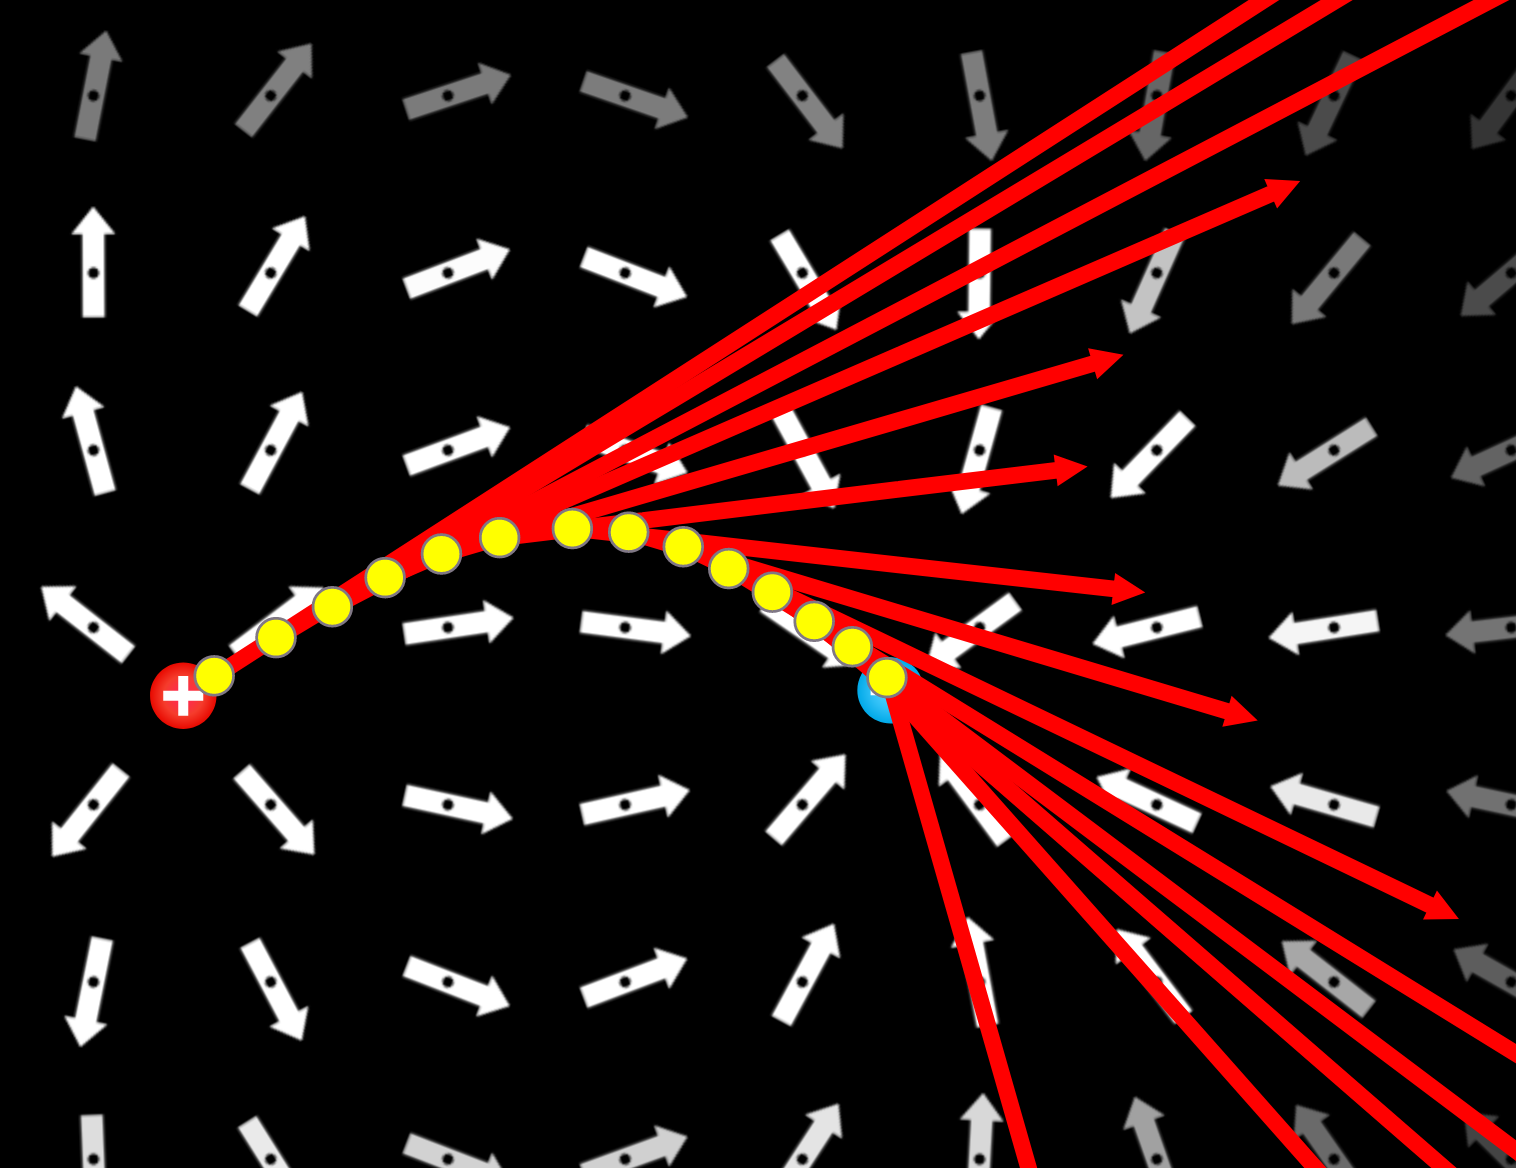
- Put one positive and one negative charge on the workspace.
- Place a test charge next to the positive charge.
- Place another test charge close to the first on the force vector.
- Repeat.
The field line is the line joining the dots. Not so obvious.