Modeling SHM and waves
SHM and waves in Excel
In this worksheet you will be using equations in Excel 2007 to make animations of SHM and waves. Before you start you need to customise excel so that you can add some controls.
Adding the Developer tools
Right click the menu bar with tabs like Home and Insert on it

Choose Customize quick access toolbar
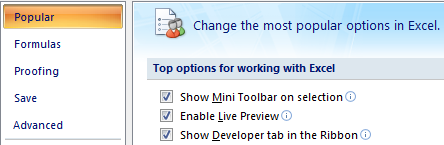
Choose Popular then tick the box “show developer tab in ribbon”.
Calculating displacement for SHM
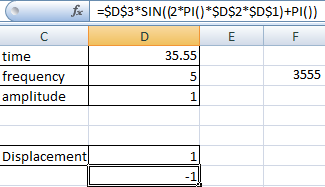
The formula for the displacement of a particle undergoing SHM is y=Asin(2πft)
where
A = amplitude
f = frequency
t= time
We can use Excel to calculate the position of a particle at a given time by placing a formula in a cell based on some values of A, f and t. Make a table like the one below and add the formula shown.
PI() is Excel for π and the $ signs in $D$3 mean that the value will always be the contents of cell D# even if the formula is copied to another cell.
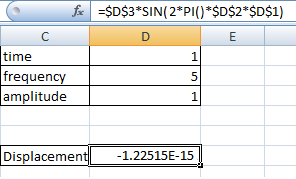
If you change t, f or A the value of y will appear in the cell. This value can be plotted on a graph by highlighting the cell and choosing “scatter” from the insert menu.

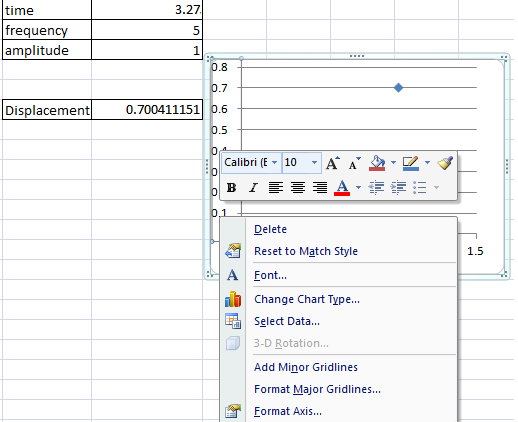
This will give a single point on a graph as shown below. If you change t, f and A the point will move accordingly. Each time it moves the scale changes. To see the movement of the point it is better to fix the axes, to do this click on the y axis and choose “format axis”.
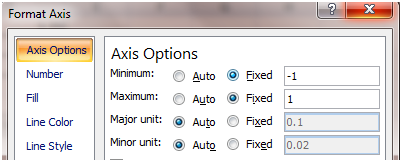
This will open a list of axis options. Choose fixed minimum value of -1 and maximum value of 1.
Animating the point.
You can see that changing the value of time changes the displacement, so if you could change the value quickly enough the point would move with SHM. To change time we are going to add a slider control.
Click the “developer” tab and insert “scroll bar” from the ActiveX controls. Drag the slider out so that it covers about 3 cells as below.

To set the properties of the slider right click it and choose properties and enter the values indicated below. close the properties window and then go out of design mode by clicking the icon.
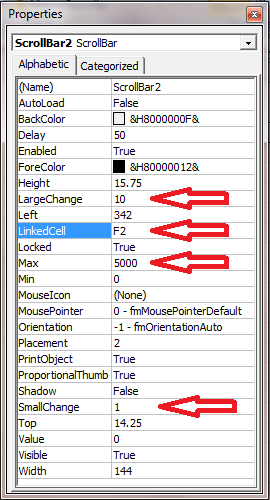
When the slider is moved it will put a value from 0 – 5000 in cell F2 clicking the arrow increases the value by 1 (small change) and clicking the body of the slider advances by 10 (large change). The time is going to be based on this value so we will put the formula =F2/100 into the time cell. Moving the slider now changes the time. We could have made time the result of the slider but then it would change in steps of 1 which is a bit coarse.
To animate the graph click and hold on the slider and the time will advance smoothly.
Phase difference
If one particle has a displacement = Asin(2πft) then a second with displacement = Asin(2πft +ϕ) will be out of phase with the first. The phase difference is given by the phase angle ϕ. To represent two out of phase oscillations copy the displacement cell down and add π to the equation as shown.
Now plot the two points by highlighting both then inserting a scatter chart. Don’t forget to fix the y axis again. Animate the points and see how they oscillate. Try changing the phase angle to see what happens.
Wave motion
A wave is made up of a lot of points each oscillating out of phase with the others, the phase is related to the position, x along the wave by the equation ϕ = 2πx/λ where λ is the wavelength. So the complete equation is y=Asin (2πft + 2πx/λ). To enter this into Excel you will first need to add wavelength to the list of constants as well as the variable x.
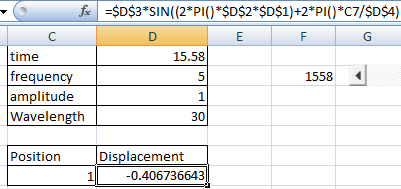
Notice that C7 does not have $ signs. This is because we want this to change when we drag the formula down which is what you are going to do next. Highlight the position and displacement cells and drag down to create about 200 values. Whilst the cells are highlighted insert a scatter chart.
When you animate this you should see a wave travelling from right to left.
- Try changing the values of f, λ and A
- Change the sign of the phase angle, this should make the wave travel from left to right
- Add two waves together
- Add two waves travelling in opposite directions to create a standing wave.
It is also possible to model longitudinal waves in excel, you can try to work out how or follow the instructions here:
Longitudinal waves