IA - Avoiding common errors
 Students are still learning how to complete an IA as they embark on this important piece of work. They gain so many new skills during the process that if it were possible to start again, once they have finished, every student would be sure to get a higher mark. This activity aims to provide students with some of these experiences before doing the IA. It will help them to get higher grades first time and help teachers to advise students how to avoid some of the common pitfalls.
Lesson Description
Guiding Question
What are the most common errors which students make in their IA?
Complete the activities below using the worksheets or on paper using this page.
Activity 1 - Avoid writing a vague, unfocused research question
![]() Worksheet for Activity 1 - Avoid a vague research question
Worksheet for Activity 1 - Avoid a vague research question
Spending ten minutes getting the research question right is time well spent at the beginning of an IA.
The first question (below) is not fully focused, the student knows what they want to do but they haven't expressed it precisely.
Students who are vague like this often don't include enough biological detail in the background, or in their conclusion.
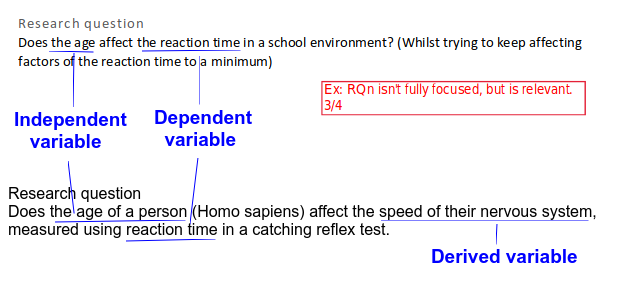
The second example is better, it describes the Independent variable and the Dependent Variable more precisely.
It also refers to a derived variable. This is really what interests the student, but it is not directly measurable. We can try to estimate the speed of the nervous system using the reaction time. So writing it into the research questions helps to guide the student in their IA.
Explaining how to work out a derived variable should form part or the background section, and this might encourage a biological explanation of how the independent variable will cause changes to the dependent variable.
The scientific names of species are also expected. Although for humans it seems a bit odd to do, better safe than sorry.
It is also good to describe the range of the independent variable which will be tested in the RQ. This can be explained and justified in the background part of the Exploration.
Help these students to improve their research questions
Improve the RQs below by:
- completing the precise details of the IV and DV.
- giving a range of values for the IV
- adding a scientific name
- including a derived variable, which is not measured, but calculated from the data.
 Student A: Jazmin is really interested in cooking and health. She has heard that it is healthier to eat raw food because cooking food damages some of the nutrients in the food. She is thinking of baking carrots at different temperatures in an oven.
RQ: How does heating carrots at different temperatures affect vitamin C concentration?
Precise IV .......................................................................................................
Range of IV ....................................................................................................
Precise DV ......................................................................................................
Scientific name ...........................................................
Derived variable ..............................................................................................
Write a more focused RQ, using these details:
...........................................................................................................................................................................
...........................................................................................................................................................................
Student B: Dara has just been on holiday and visited the Dead sea / Sea of Salt: البحر الميت. He liked being able to float easily in the water but was shocked to find out that there is no life in the sea because it is too salty. He wants to find out what is the maximum salinity that can support life. The Dead sea has a salinity of 342 g/kg, or 34.2%. He is thinking of growing yeast in different salt concentrations and measuring the rate of growth of the yeast population using a colorimeter.
RQ: What is the highest salt concentration which can support life, using yeast as a model species?
Precise IV .......................................................................................................
Range of IV ....................................................................................................
Precise DV ......................................................................................................
Scientific name ...........................................................
Derived variable ..............................................................................................
Write a more focused RQ, using these details:
...........................................................................................................................................................................
...........................................................................................................................................................................
Activity 2 - Avoid omitting biological theory in the background section
![]() Worksheet for Activity 2 Avoid omitting biological theory
Worksheet for Activity 2 Avoid omitting biological theory
Some students collect relevant pieces of information for the "Background" of their IA without deciding first what are the details which the reader needs to know to understand the context of the IA.
- Why is the question interesting? (Engagement)
- Why does the IV affect the DV? (Hypothesis)
- What reasoning was used for the choice of the range of IV? (so the Method tests the Hypothesis!)
- What apparatus, chemicals or techniques does the reader need to know? (Methodology)
- How will you take the results collected and use them to answer the RQ? (plan of Analysis)
Evaluate the Background information below.
Annotate the text to show each type of content. Can you identify which part of the background has been left out?
Background:
Saccharomyces cerevisiae (more commonly known as yeast) is a commonly found microorganism used in the food industry (brewing and bread making) and bio-fuel. Yeast takes in its water through osmosis. Osmosis by definition is “diffusion of free water molecules from a region where they are more concentrated to a region where they are less concentrated across a partially permeable membrane” .
My concept therefore, is that as the salt concentration outside the yeast cell increases, the concentration of water molecules will then be greater inside of the cell than outside. Thus, the water molecules will then pass back out of the cell into to lower concentrated solution surrounding the organism via osmosis. This will result in the yeast dehydrating. Yeast cells contain enzymes that need to be in solution in order to ensure metabolic reactions, including DNA replication, needed for cell division. When the yeast cell dehydrates, the enzymes can no longer function and thus metabolic reactions needed for survival, such as respiration, do not take place.
My experiment will measure the growth of yeast populations by using absorbance of light by a suspension of growing yeast cells in a colorimeter. If the yeast cells are living, they will continue to divide through the process of mitosis resulting in a more opaque solution, thus more of the light will be absorbed. If the cells do in fact dehydrate, the cells will no longer divide and the yeast solution will stop becoming more transparent and the amount of light absorbed will not change.
I decided upon using yeast because it can live in a variable environment . Using a bacterium such as Escherichia coli would not be appropriate, as they do not have a high salinity tolerance. E.coli also does not run the risk of becoming a harmful pathogen, and therefore I could easily transfer it from test tubes to colorimeter vials without any risk to health. In addition, because I could transfer samples easily it meant that I could use larger volumes of my yeast solution, which made creating different concentrations much easier.
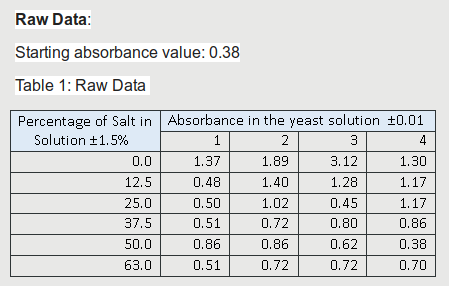
The Dead sea has a salinity of 342 g/kg, or 34.2% so I chose a range of salinity from pure distilled water 0g/kg to a concentration double the salinity of the red sea. I wanted regular intervals between concentrations so I chose the six concentrations shown in the Raw data table below, each with an interval of 12.5g/kg.
Here is the raw data which was collected in the experiment after 24 hours of yeast incubation at 37°C.
Write a paragraph explaining the missing information
Outline how we could use the raw data collected to answer the RQ."What is the highest salt concentration which can support life." Keep it general, it is for the background, full details of calculation will be provided in the data analysis section.
...........................................................................................................................................................................
...........................................................................................................................................................................
...........................................................................................................................................................................
...........................................................................................................................................................................
...........................................................................................................................................................................
...........................................................................................................................................................................
Activity 3 - Avoid forgetting to control variables in the method after identifying them
![]() Worksheet for Activity 3 avoid forgetting to control variables in the method
Worksheet for Activity 3 avoid forgetting to control variables in the method
The student identified the following variable which would need to be controlled.
Controlled variables:
- Mass of yeast: To make it a fair test this should always be the same.
- Temperature of the solutions: so that the yeast grows at the same speed in each experiment.
- Total volume of solution: so that concentrations don't vary.
- Time allowed for yeast growth: so that yeast grows for the same time in each.
- The amount of stirring / shaking: So that there is the same amount of oxygen dissolved in the solution, for aerobic respiration.
- The type of yeast used, and its freshness / age: Some yeast might grow faster than others.
- The concentration of sugar added: So yeast has the same amount of 'food' in each experiment.
In his experiment Dara wrote;
Method:
I measured out 250 ml of warm water from the tap using a 250 ml measuring cylinder. To this, I mixed in 20g of sugar weighed in a weighing boat using a 2d.p balance in the largest beaker available. This created a 17% sucrose solution.
I then added 20g grams of dried yeast and let the yeast grow for 24 hours.
After this 24-hour period, I took a sample of the yeast solution and placed it in a vile to be placed in the colorimeter.
I then calibrated the colorimeter machine, checking that the absorbance reading was 0.00
After this, I took an initial absorbance reading using the sample of yeast solution I collected.
Making sure the yeast solution was well mixed I measured out 8 ml of the solution, using a 10ml glass measuring cylinder, into 20 15ml test tubes. I labelled 4 test tubes as 0%, 4 as 12.5%, 4 as 25%, 4 as 37.5%, 4 as 50% and 4 as 63%. and added the salt solution to each labelled test tube and shook well.
I let the yeast grow for another 24 hours.
I shook the test tubes again and then placed a sample of each solution into colorimeter vials. After calibrating the machine, I tested the samples of each test tube and recorded the absorbance value.
Add details to the method completing the practical control of all six variables.
Students sound more convincing if the step-by-step method includes control of variables.
Outline how to control each variable mentioned below. Write it in the same style as the step by step method above. (Using first person isn’t the best style but it is not penalised at IB.)
The temperature
...........................................................................................................................................................................
...........................................................................................................................................................................
The amount of stirring / shaking
...........................................................................................................................................................................
...........................................................................................................................................................................
The type of yeast used, and its freshness / age
...........................................................................................................................................................................
...........................................................................................................................................................................
Activity 4 - Avoid doing the data analysis without understanding why
![]() Worksheet for Activities 4&5 - Avoid misunderstanding the data analysis
Worksheet for Activities 4&5 - Avoid misunderstanding the data analysis
Some schools seem to tell students to do a selection of graphs and statistical calculations. While it is important that teachers guide students in the analysis, students need to choose the data analysis method themselves.
It is only possible to choose correctly if students understand why they are doing the analysis.
Describe what the purpose of each data analysis method is, and when you might use it.
This is a list of ten possible types of data analysis. Some of the explanations have been done already.
For any methods which are unknown, look up the method, and note down it's purpose.
| Data analysis method list | Purpose and when you might use this method |
|---|---|
Calculate derived variable values using the raw data | To calculate a derived variable that helps answer the research question, when the raw data measured (IV) is used because it can be measured but the derived variable cannot. (For example, your raw data is 'absorbance' and you need to know 'how much the yeast has grown' or 'is it alive?'. A common example is the raw data, 'time taken' used to calculate the 'rate of reaction.' |
Plot a scatter graph of all the raw data | |
Calculate a mean average for each value of the IV | To show a trend more clearly, where there are repeated results, and data are scattered. |
Calculate the standard deviation | To show the size of the 'scatter' in repeated results, when results show variation. |
Plot a bar chart of the averages with standard deviations | |
Plot a scatter graph of averages with standard deviations | |
Plot a box and whisker graph | To show the median values and the size of 'scatter' when the data is not normally distributed, or when there are too few data points to calculate a standard deviation (<5) |
Calculate the R2 statistic | . |
Calculate a students t-test | . |
Calculate several t-test between the most different data | This is not a good method, for two reasons.
|
Calculate the ANOVA statistic | . |
Help Dara choose the data analysis for his experiment.
Which steps would be suitable for Dara's experiment on Yeast?
- .................................................
- .................................................
- .................................................
Activity 5 - Forgetting to include a strength and an extension in the Evaluation
![]() Worksheet for Activities 4&5 - Avoid forgetting a strength and an extension.
Worksheet for Activities 4&5 - Avoid forgetting a strength and an extension.
Students who are running out of time, and perhaps enthusiasm, usually forget to include these less prominent details in their Evaluation section. This impacts on their marks.
There is no excuse for this. A little thought and two sentences will cover these details in most cases.
A table of limitations and suggestions for improvements also safes time, and avoids the risk of forgetting an improvement for each limitation.
Evaluation:
A strength of this experiment is I used an effective range of salt concentrations and attained very consistent results showing a reliable method.
As an extension to this experiment it would have been interesting to look at whether the decomposition of dead cells in the solution have any effect on the light absorption of the solution, explaining why my final value was higher than my starting value.
Limitations | How it could affect data | Improvements |
Vials had scratches | If a vial was scratched it would increase the absorbance reading. | Use new vials. |
I had no control over the thermostat in the lab. | All of the yeast was grown in the same room, therefore all of the data would be affected equally. However, a cooler temperature could have decreased growth. | Do the experiment in an incubator at 25°C to keep the temperature constant. |
Help Dara think of another idea for a strength and an extension.
A strength of this experiment is ........................................................ .................................................... .................................................... .................................................... ....................................................
An extension to this experiment could be ........................................................ ....................................... .................................................... .................................................... ....................................................
Teacher's notes
Alternatively they could be selected one at a time, during practical lab work to emphasise each of the points.
Model answers are available here: IA avoiding common errors - model answers Teachers can control access to this page for their students by using the Inthinking Biology 'Student access'
Reminders of the purpose of the background section:
- It needs to be focused (not long and waffling) and can include a citation(s) in support of the theory
- It should be linked to the research question.
- The choice of independent variable, and its range, needs to be justified.
- The reasons for expected changes to the dependent variable should be explained using some biological theory.
- The identification of controlled variables is best when it shows an understanding of the other factors that may alter the results, rather than a quick list of other variables.
- If it happens, there should also be a recognition that some variables (e.g. room temperature) may be uncontrolled.