Stats & Probability GDC
 Video Tutorials/Activities for the TiNspire and Casio (HP Prime to follow . . . .).
Click on the 'Table of Contents' text above to quickly navigate this page.
Below you will find links to a growing number of video tutorials (or key screenshots) on how to use your TiNspire, Ti-84 or Casio calculator, for the Statistics and probability module.
Generating Poisson, Normal, Binomial etc Probabilities and Expected Frequencies
TiNspire

Casio

TiNspire
T-test
SL: the 2-sample 'pooled' Ttest
Casio
TiNspire
Ti-84
In IB exams it is assumed that the standard deviation of both sets of data and approximately equal, therefore students will ALWAYS select "pooled"
Select POOLED: "YES" - where the video below chooses "no".
Apologies for the name of the channel from which the above video comes (it may make some students feel less alone though . . . and help change their view!).
Confident intervals
T-distribution confidence interval from a list of data: TiNspire
The below example uses a 99% confidence interval (w

HLonly: Sample means
TiNspire
If the population standard deviation is known, use z-test (normal distribution of sample means). If it is unknown (or known, but sample size n < 30) use t-test (t-distribution). Explanations and example below:

Example of a one-tailed, 'less than' t-test given an unbiased estimate of the population mean = 284.05 and standard deviation, Sn-1 (=Sx on calculators) = 52.7, sample size = 15, and ensuring GDC graphs the result to provide a visual check for the user that the calculation matches what the probability they wished to work out.
In a "Lists & Spreadsheet" page (to ensure, 'shade P Value' option) > 4.Statistics > 4.Statistics Tests

Normal distribution: with Graph plot
All normal distribution methods e.g. invN, normpdf also included)
Casio
Ti-84
The Ti84 is probably the easiest calculator to find support for online: a quick Google search or Youtube always (in my experience) provides a number of clear explanations for students to follow. Example below:
Ti-Nspire

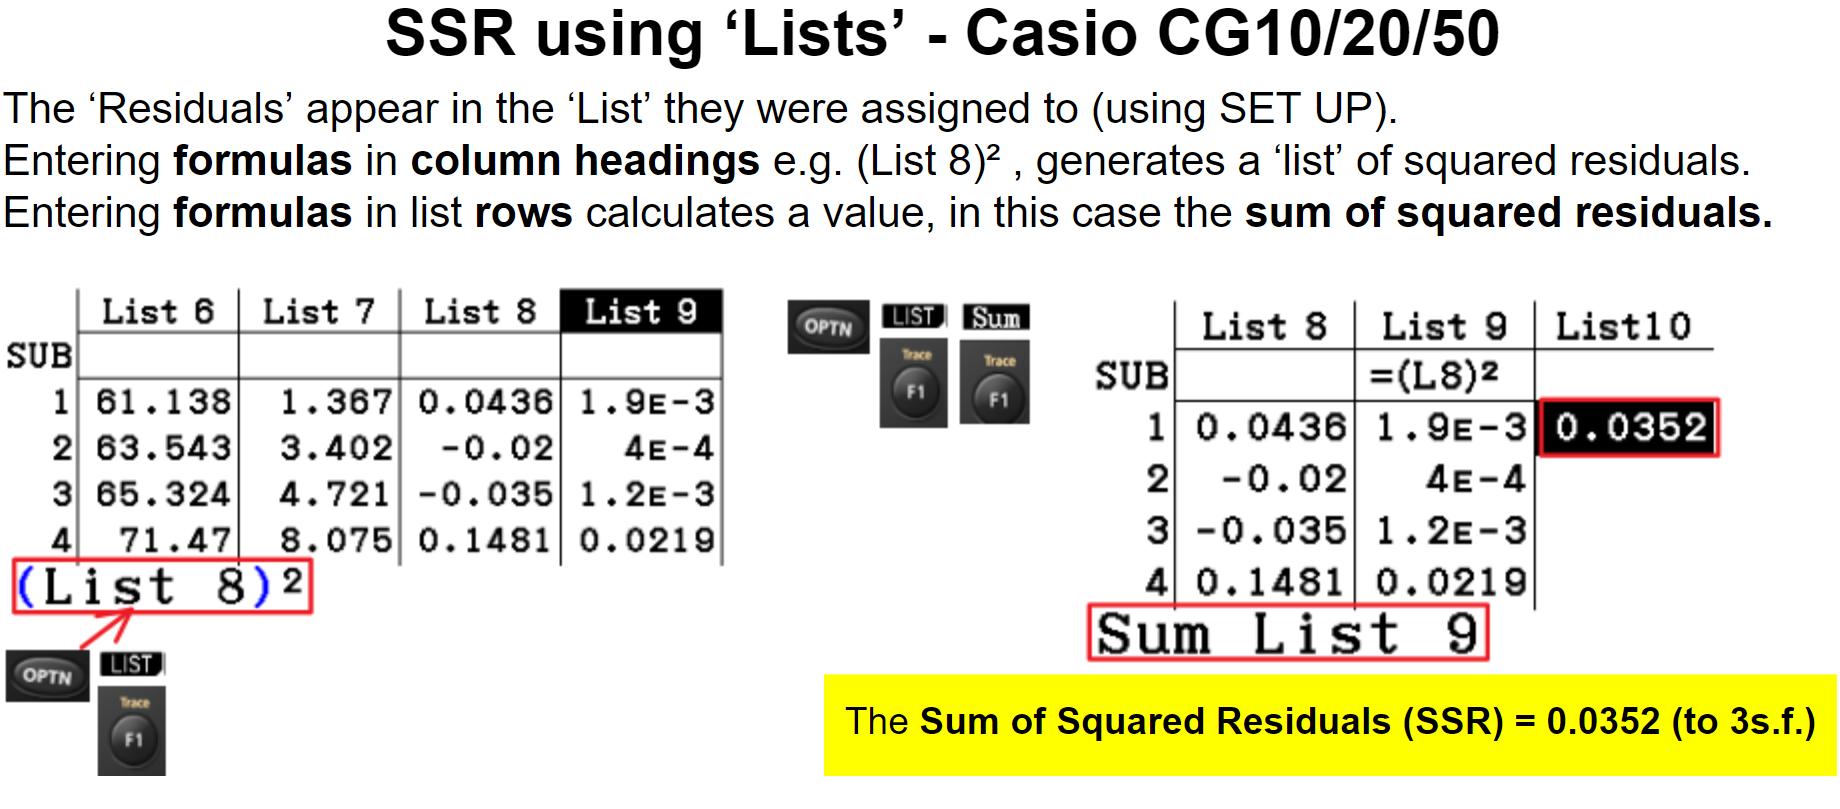
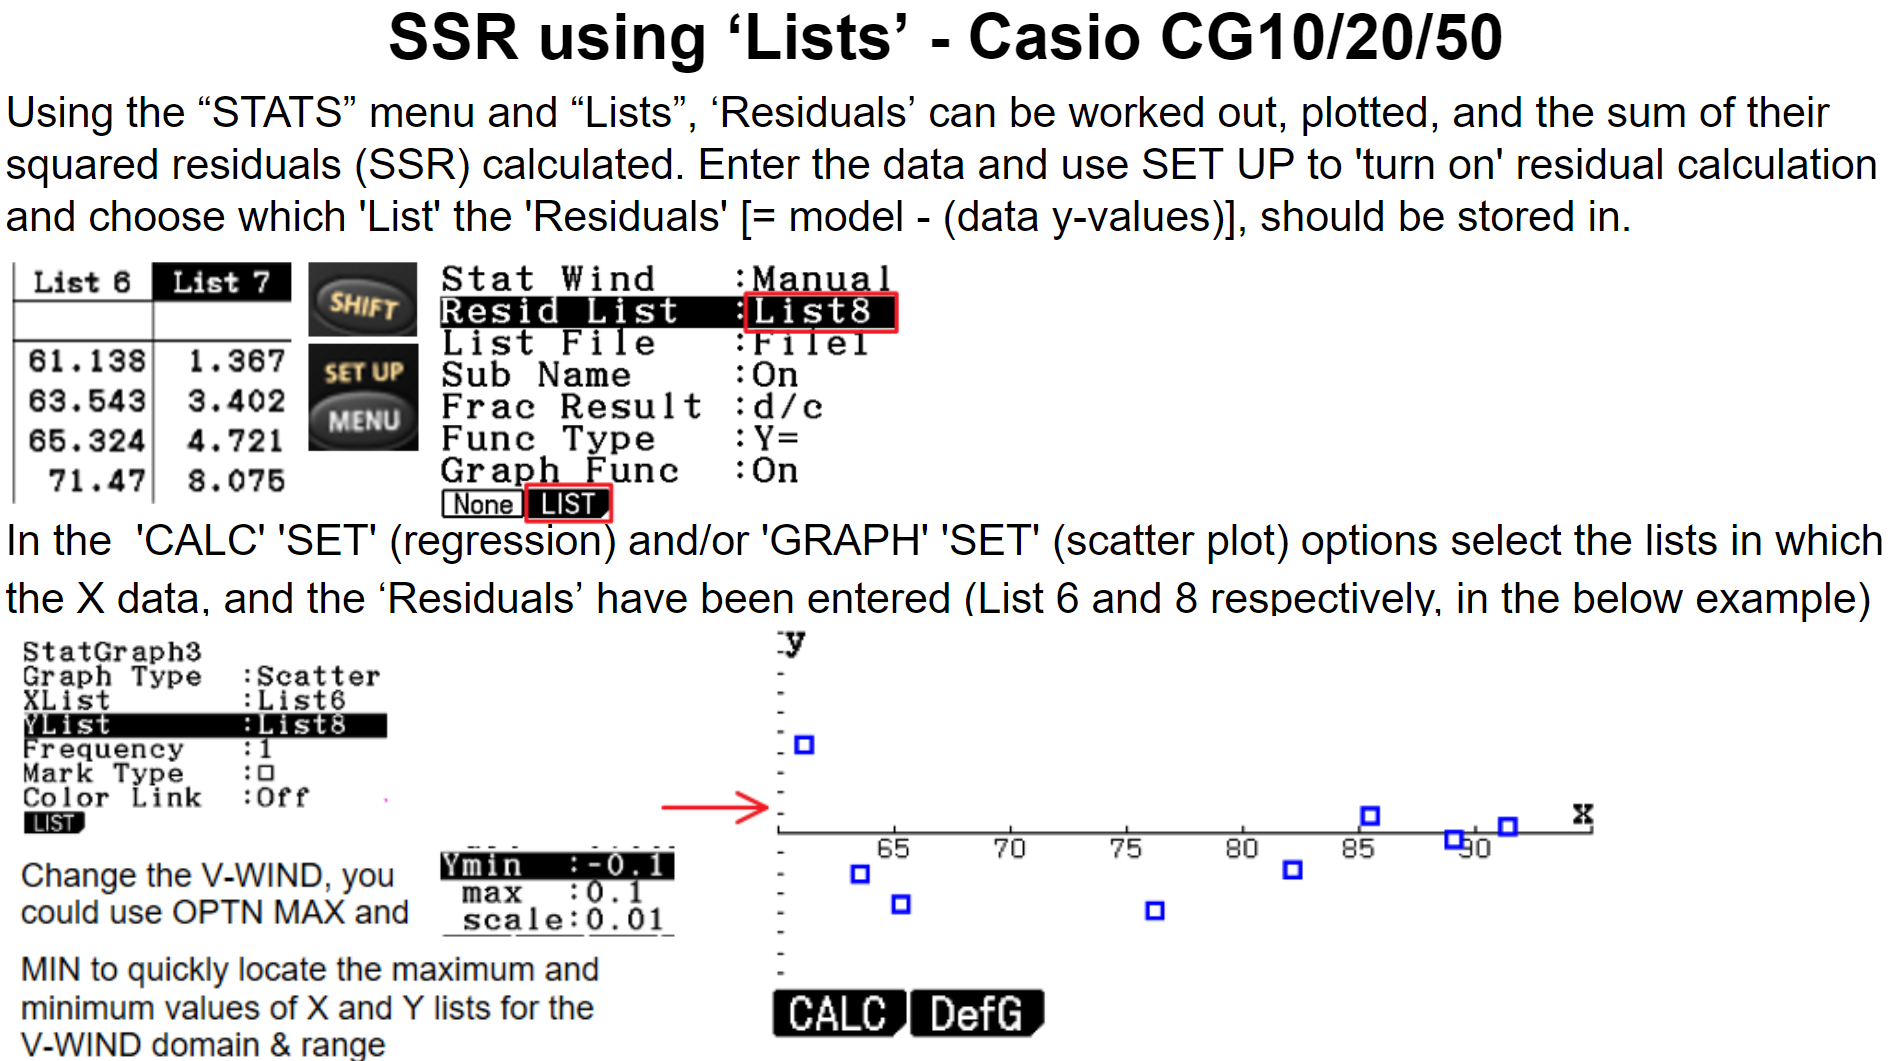
Sum of Squared Residuals (SSR)
Casio: SSR
METHOD 1: MSE x (n-p) [n=sample/n° of pieces of data, p=n° of parameters(coefficients+constants in the model)]
It's important to be aware: regression coefficients and SSR values are likely to differ if you use the same data, but to a different degree of accuracy. Do not assume you have incorrectly followed the process if your answers differ by
only a little, the most common reason is using a different level of accuracy in the data that was entered.xmse.png)
METHOD 2: Turn on 'Residuals', Square & sum them
TiNspire: SSR = stat.resid²
Quick method for LINEAR regressions only
Once the TiNspire has fitted a LINEAR function (log-linear, or straight line regression equation) to a set of data the option to "Show Residual Squares" becomes available.
Clicking back on the "regression line/graph" produced automatically displays the sum of squares on the screen.
SSR that works for ALL functions

Example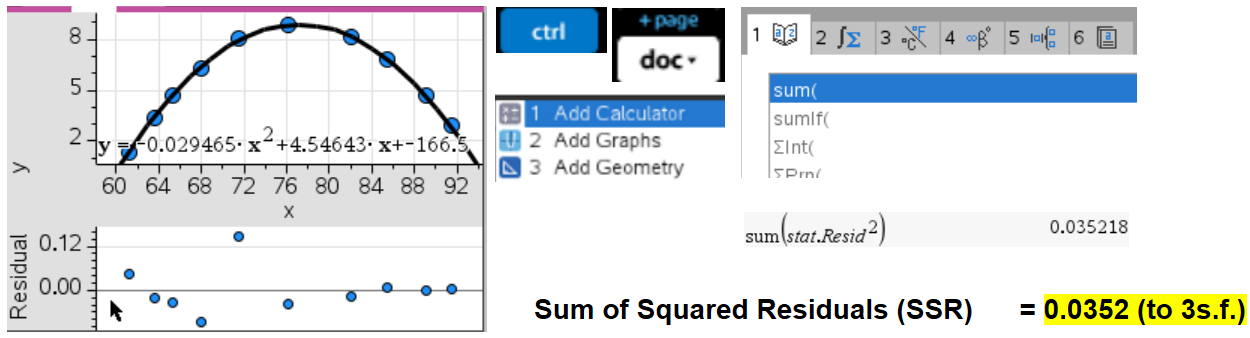
CHECK: This is the same answer as given by the Casio above (using the same data)