Optional Practical: Drinking straw waves
Introduction
In this experiment the programme “Audacity” will be used to measure the frequency of the standing wave produced when air is blown through a drinking straw. The data collected will then be processed in excel and a graph plotted such that the velocity of sound can be found.
Making the pipe
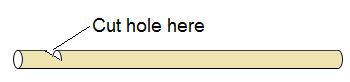
The normal way to make a drinking straw instrument is to cut a flattened end into a point. When blown through the points vibrate like the reed of a clarinet. The vibrating air resonates with the pipe producing a note. I tried this method but the results were poor, maybe due to the bad quality of the note. I found that although making a hole in the side of the straw produced little sound the results were much better. So, cut a hole in one end of the straw as shown.
Blowing down the pipe makes a fairly unimpressive whistling sound that is loud enough to be analysed.
Using Audacity
If you haven’t got Audacity on your computer download it from here: http://audacity.sourceforge.net/
When installed, double clicking the icon will open the following window.

Notice the sampling rate (bottom left) is 44100 Hz and will go up to 96000Hz this is very fast.
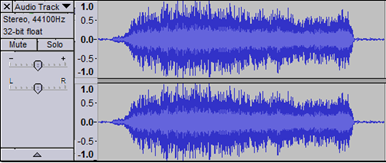
To record sound you simply click the red button and make the sound into the microphone (make sure your microphone is connected and activated before opening audacity or it won’t work). Try playing with the controls so you know how to record a sound. You will get a trace like the one below.
To find the frequency of the harmonics a frequency spectrum can be plotted. To do this choose “plot spectrum” from the analyse menu. It should look something like this:
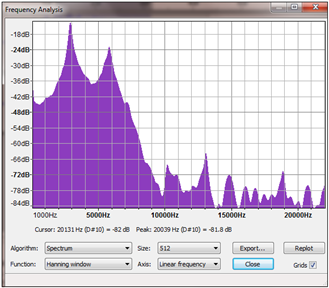
The first harmonic is the lowest frequency peak. Put your cursor near to this peak and its frequency will be displayed below.
Theory
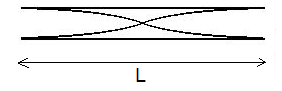
The drinking straw whistle is open at both ends so the wavelength, λ of the first harmonic is equal to 2L as illustrated below.
The velocity of the wave is given by the formula v =fλ. By measuring the frequency of the first harmonic produced by blowing through different lengths of pipe, use a graphical method to find the velocity of sound.