Example results
Decay of Beer Foam
Data Collection
In this experiment I marked the height of beer in a measuring cylinder every 5 minutes to do this my partner watched the clock and said "beep" every 5s, at this moment I marked the beer height. The zero mark was the level of the beer after over 5 minutes had passed, measuring from this level the following table of results was constructed.


The uncertainty in the time measurement was due to the reaction time between me hearing my partner saying beep and marking the tape. I was probably always a bit late so this may be a systematic error rather than a random one.
The uncertainty in measuring the height was due to the difficulty in measuring the actual position of the line, this was made more difficult by the fact that the pen line was quite thick and not straight.
To see how it looked the raw data was used to plot the exponential decay curve shown below.
Data Processing
We are given that h=hoe-λt If we take logs of both sides of this equation we get
logh=logho-λt
So if I plot logh against t I will get a straight line with gradient=-λ
So I need to process the data to find logh and its uncertainties.

The uncertainty in Log(h) has been calculated by finding the max and min values of h by adding and subtracting the uncertainty. Having done this the max and min values of Ln(h) were found and the uncertainty calculated from ½(max-min).
Data Presentation

From this graph we can see that the best fit line does not pass through all the error bars so I can not conclude that the exponential relationship is valid so I have not drawn the steepest and least steep lines through the data point. the main problem seems to be that the pencil line is too thick to distinguish the change in height for such short times. For that reason I decided to try a different method making a video of the rising beer and using the video analysis option in Loggerpro to measure the beer level at different times. The data and a screen shot of the video being analysed is shown below.
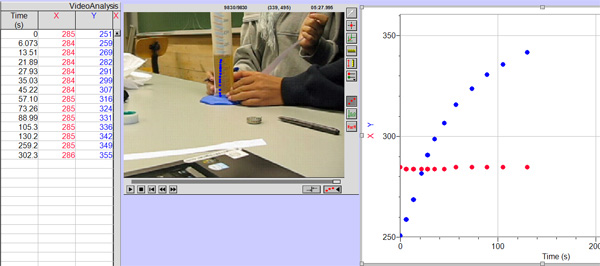
Using this method I obtained the following results and graph

And the graph

The uncertainties in time and height are derived from the smallest level of resolution in loggerpro.
From the best fit line λ=0.01682s-1 , this gives a value for the half life to be Ln2/0.01705 = 41.2s
The max value is λmax=0.1705s-1 so min value for half life = 40.6s
The min value is λmin=0.01517s-1 so the max value for half life is 45.7s
The uncertainty is therefore ½(45.7-40.6)=2.55s ~ 3s
Conclusion
Although the first results were inconclusive the closeness of the data points to the best fit line in second set of results showed that ,within the uncertainties of the experiment, the decay of beer foam was exponential.
The value obtained from the gradient of the second graph was t½=41±3s
This is quite close to the approximate value of "around 50s" given by our teacher. Looking at the graph I think that the result we achieved is quite reliable and varies from the expected because of variations in type of beer, temperature and container used in the experiment rather than our lack of accuracy.
Evaluation
Although the exponential curve looked ok the original method did not give good results as can be seen from the log graph. Looking at the data I can see that there were many several similar readings for consecutive times (50,55 and 60s for example). This was due to the insensitivity of the method.
From the graph of h vs t for the first method it can be seen that the graph levels out at 3cm rather than the expected 0cm. This could be corrected by subtracting 3cm from each value of h suggesting that the mark for the final level of the beer was placed too low down the tube. This is strange since when I marked this point there was still foam in the tube so I would have thought the mark was too low not too high.
The second method gave much more consistent results except for one point (the last one) which I left out when plotting the best fit lines. If I consider this point with the way the previous graph seems to level off before time it seems to suggest that the decay of beer foam is exponential at the start only, the foam that is in contact with the glass seems to last much longer.
The second method gave data with much smaller uncertainties and a best fit line that was closer to the data. The main difference being that I could spend time marking the beer level, in the first method I was always rushed to mark the level at the right time.
It might have been better to take measurements every 10s instead of 5. It would also have been better to use a finer pen to mark the level. The second method could be improved by zooming in closer to the cylinder and mounting the camera on a more stable stand. Even though it was mounted on the table there was still some movements that was noticeable on the film. Any movement of the camera will affect the measurements.