Activity: Spacetime diagrams

Time for a bit more interaction. Today you will construct an interactive space-time diagram using GeoGebra and, as a result, understand how space-time diagrams can be used to represent events in two frames of reference.
 I should first clearly acknowledge the work of Kristian Evensen who created Interactive Minowski which gave the inspiration for this worksheet and was a great help when making diagrams for my text book.
This isn't for the GeoGebra beginner but if you know the basics then you should be able to follow the instructions. Space- time diagrams are used to represent the transformation of space and time between two frames of reference. The way this is achieved is by inclining the time and distance axis.
The first thing to realise is that in a space time diagram time is represented on the y axis. To make things simple time will be represented in units of 1 s and distance in light seconds this will make the gradient of a body travelling at the speed of light =1 (You could also use time in years and distance in light years)

So for the graph above the velocity of light = 1/gradient = distant travelled by light in 1 second /1 second. A body travelling at less than c will have a gradient greater then 1 (remember time is the y axis).
Note that because of the units v will be expressed in terms of c so if gradient 1, velocity = c. If gradient = 2, velocity = 0.5c
- Open a new GeoGebra file.
- Add labels to the axis. (right click workspace>graphics>axis)
- Add the line y = x (type y = x in the input line at the bottom of the window)
- Change colour of line to red (Right click line and choose properties)
To represent the position of a body travelling with velocity v we could draw a new line, this would have a gradient equal to 1/velocity of the body. so the equation of this line is y = x/v.
- Add a slider for v from 0 to 1 increment 0.1
- Add the line y = x/v
- Change colour of line to blue.

At time t = 0 the car and the girl were in the same place but after 6s the car has moved 3 light seconds from the girl (fast car). The blue line represents the position of the car at different times.
If there was an observer in the car then the observers frame of reference would be different from the little girls. We could represent the time axis of the cars frame with the blue line already drawn. Let's now find coordinates of an event using these two frames of reference. First we must add an event A.
- Add sliders for d and t from 0 to 20 increment 0.01.
- Add point A and replace its coordinates with (d,t)
This is how to change the coordinates of a point
To show the coordinates of the point in the girls frame of reference:
- Add lines y = t and x = d
- Add points were lines intersect axis.
- Add line segments joining point A to each point on the Axis.
This is how to add a line segment:
- Hide the lines y = t and x = d and make the segments dashed.
As you move A by varying d and t the dashed lines will show the coordinates according to a the original frame of reference. Note how this works: To measure time you draw a line parallel to the distance axis and to find distance you draw a line parallel to the time axis.
In classical mechanics the time measured in each frame will be the same but the distance to the event will be changing. If the event takes place somewhere in front of the car then the car will be moving closer to the event but the girl isn't. To measure the position of the event in the car add a line parallel to the blue line.
- Use the parallel line tool, click the blue line then point A.
- Add a point where the new line intersects the x axis.
- add a line segment between the two points.
- hide the original parallel line and make the segment dashed.
So an event that takes place at time 4s, 4 ls from the girl will take place at the same time but only 2 ls from the car.

We can also use this method to measure velocity. A body travelling from the origin to point A will have travelled 4 ls in a time of 4 s, a velocity = 1(c) the body in this case must be a photon of light.
If the velocity of the photon is now measured relative to the car, the distance travelled is only 2 ls so the velocity = 0.5(c). The velocity of light is therefore different to each observer which we know can't be true.
To fix this problem we can tilt the distance axis with the same angle as the time axis.
- Delete the last point, segment and line that were drawn parallel to the blue line (you could use undo).
- Add line y = vx
- Change the colur to blue.
This is the distance axis for the cars frame of reference, notice how the axis change as you vary v. The red line representing the velocity of light is always in the centre of these lines, it will therefore always have gradient = 1.
To measure position and time of event A with this frame you need to draw lines parallel to the each blue line resulting in something like the diagram below.
- Follow the same procedure as before adding parallel lines, point at intersection, line segment etc.

This gives the idea of the space-time diagram in that you can move the event around and see how the coordinates change however, you can't get any values for the cars frame of reference as there isn't any scale on the blue axis. This is rather difficult to fix so instead of adding a scale we will display the car coordinates on the points.
Lets first define that all values relating to the girl are d, t etc. and those relating to the car are d', t'.
According to the Lorentz transform:

- input d' = (d - vt) / sqrt(1 - v²)
- input t' = (t - vd) / sqrt(1 - v²)
- Add text t' = "object t'"
- from text properties position tab select the point that represents t' on the t' axis.
- Repeat the process to put labels on d' then d and t.
- If you haven't done it already hide all the unwanted labels.
Your simulation is now ready to use set v = 0.4.
One of the confusing aspects of examples in relativity is that, unless the observer is at the same place as the event, events are not observed at the same time as they happen. This is why, in the examples in my book, I use clocks that are always in the same position as the event. The reason for this difference is that it takes time for light to travel from event to observer, this can easily be shown on a space - time diagram by adding the path taken by light, you have already drawn this in the forward direction but light can also go backwards so add a new line y = -x. Light travelling from an event at (0,0) will follow these lines. In 2 dimensions this would form a cone, a light cone. You can find out when an event would be observed by dragging the light cone to the event.
- Move point A to d = 3.58 ls, t = 2.45 s
- Drag the light cone (y = x and y = -x Lines) to so they cross at A
- At what time was this event observed by the girl and the car?

Event A takes place in front of both the girl and the car so light must travel in a negative direction to reach them. Light reaches the car at 4s and the girl at 6s.
In examples used to illustrate simultaneity the observers are often placed midway between the events, this is the case in my book where clocks are synchronised as two observers pass each other.

In terms of girl and car this would be.

To represent this situation we must move the girl from observing at the origin to making observations somewhere along the x axis e.g 2 ls from the origin
- Create a line parallel to the t axis and move it so it passes through x = 2. This is the timeline or the girl
- Create a line parallel to the t' axis and move it so it also passes through x = 2. This is the timeline for the car
- move A to x = 4
Note that when the events (simultaneous to the girl) take place the girl and car are at the same place.
- Move the negative light line to coincide with A and leave the positive one at the origin.
- Determine that the two events were seen to be simultaneous to the girl but not the car

The same method can also be used to show that if we take two events that are simultaneous as observed by the car will not be seen to be simultaneous as observed by the girl.
- Place event A on the x' axis so d' = 4 ls
- Place the t' time line so that it passes x' = 2 ls
- Place the t time line so it also passes x' = 2 ls
- Move the negative light line to A
- Deduce that the events are observed to be simultaneous to the car but not to the girl

Two events that take place at the same position according to the girls can be represented by points on a line parallel to the t axis. If F is one event then a second event at the same place according to the girl will be represented by a point on the t axis.
- Place point A at the 4s mark on the t axis.
- What is the time between events F and A according to the girl
- What is the time between the events for the car?
- Check you answer using the time dilation formula.
t' = 4.36 s
- Make an event that happens at the same place as F but 4s later with respect to the car.
- How long after event F did this take place according to the girl?

This is tricky but can be done, the problem is that to determine the length of a rod you have to measure both ends at the same time.
- Place A on the x' axis where d' = 4. This represents a rod extending from F to A that is stationary in the car so is moving between the parallel green lines shown below.

- Add the green line parallel to the t' axis passing through A.
- Add a point where the green line intersects the x axis.
To measure the length of the rod the girl must be locate the two ends simultaneously. This means they must lie along the x axis. The length measured will therefore be the distance between the green lines along the x axis.
- Use the point G to determine the length as measured by the girl.
- Check your answer with the length contraction formula.
L = 3.66 m
Drawing this is a little confusing because it looks like the rod is at an angle to the girl but remember there is only one dimension of length in this diagram so the rod can not be at an angle.
Imagine that it is dark and the rod has a flashing light at each end. The only way to measure the length is to measure the distance between the flashing lights but the lights must flash simultaneously. For the car simultaneous flashes occur at F and A but to the girl simultaneous flashes occur at F and G.

Velocity is displacement / time so to find the if a body travels from (0,0) to position A then v = d/t and v' = d'/t'
- Place A at 2 ls, 4s.
- If a body travelled from (0,0) to A determine its velocity as measured by the girl.
- Determine the velocity measured by the car.
- Use the velocity transform equation to check your result.

"Ann and Sue are twins. Sue takes travels at 0.66 c away from the Earth for years (as measured by her own clock) then turns around and comes back how much time has elapsed for Sue?"
This is called a paradox since if you consider it superficially each twin will see the others clock tick slowly so will think the other will be younger. A space - time diagram clears up the mess.
- The problem is in years and light years so you can change the labels or just leave them and remember.
- Set v = 0.66
- Sue travels at 0.66c so her time line is the t' axis, place event A at t' = 3 yr
When Sue turns around to come home her timeline will be flipped. In other words it will be a reflection of t' in a vertical line.
- Select "reflect object in line" from the toolbar.
- Click the t' axis then the x = d line.
The time of return measured by Ann can be read off the t axis and the time for Sue is twice the time taken to reach the turning point (due to symmetry). So who is the oldest?

Ann has aged 8 years Sue has aged 6 years.
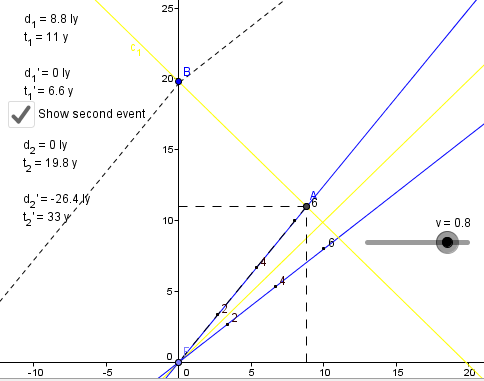
"Ann and Sue are twins. Sue remains on Earth. Ann travels to the star Sirius in a spaceship moving at 0.8c relative to the Earth. The distance between the Earth and Sirius is 8.8 ly measured relative to the Earth (or Sirius). As Sue approaches Sirius, she sends a radio signal back to Sue. Determine the time that it takes for the radio signal to reach Sue."
The third problem is that there are 3 events.
- Spaceship leaves
- Spaceship sends signal
- Earth receives signal
So you need to add an event, I have done this for you here (I also changed the scale to years and light years and extended the range for time and distance).
- Set v = 0.8
- Place event A at d = 8.8 ly on the t' axis. When on the t' axis the time in t will be 11 y since it will take 11 yr to travel 8.8 ly at 0.8c measured from the earth.
If you have adapted your own simulation you can place A precisely by typing the coordinates in the algebra pane. Zooming in will help you place the lightline and point B.
The spaceship now sends a signal to Earth, this can be represented by the light line.
- Move the negative light line so that it passes through event A
Event B is when the light reaches the Earth this should be at 19.8 yrs
- Place event B on the intersection of the light line and the t axis.
Now you can see when the radio signal reaches the earth according to the Spaceship (Ann) (33 years or 33 - 6.6 years after the message was sent)
- Lock the x and y axis so they always have the same scale by right clicking on a blank area of the graph and from graphics > preferences > basic set x:y to 1:1 and lock by clicking the padlock.
- Add a line segment (m) from the origin to the point representing t' and hide it.
- Add a circle with centre (0,0) and radius 2m/t' (if 2m is the distance from the origin to point representing t' then 2m/t' will be 2 units long).
- Add points were the circle intersects t' and x' axis.
- Make the points small and black.
- Hide the circle and all labels.
- Repeat for the 4 and 6 markers (you can add unit markers if you like).
- To display the numbers open point properties enter the relevant number as the caption tick "show label" and change to caption.
- Now you have scales it might be neater to remove the floating values and place them somewhere else.
- To add a t' x' grid to the graph you can add lines parallel to x' and t' that intersect with the scale points.
Alternatively a neater version suggested by Maciej Pietka is to use the sequence function and the equation of the lines that mark the grid lines. To explain this requires the use of the reverse transformation but you can simply copy the code:
- Sequence[ y = v x + i sqrt (1- v^2), i, -5, 5 ]
- Sequence[ y = (x - i sqrt (1- v^2)) / v, i, -5, 5 ]
I don't like adding details without explanation so here is my attempt to explain the equations for the d' grid lines (t' have a similar explanation):
The grid lines are parallel to d' so have the equation y = vx + k where k is the y intercept. To plot these lines we need to know the intercept so lets take a point that we know is on the line and use the equation to find the value of k. Let's consider the convenient point below.

Lines on the graph are all plotted with respect to the original x and y axis (d and t) so we need to know the coordinates of this point in the girls frame of reference. We can see that d' = 1 l s and t' = 1 ls but what do d and t equal?
Here we have to use the reverse transformations

What the sequence function does is plot one of these lines for every second in t'.
The equation for the time lines can be derived in a similar way but maybe that's enough maths for now.
Here is the clean version (to save time you could use this):