Rolling cylinders (Hamza)
ROLLING CYLINDERS:
By Hamza Jalil (UWCRCN 2016)
INTRODUCTION:
In this experiment the velocities of two different kind of cylinders (hollow and solid) will be compared in relation to the height of the slope they roll on. We performed a similar experiment in the beginning of our first term discussing the relation of height of a slope and the final velocity of a ball rolling on it. Our results, however, were not correct at that time as we only considered the sliding of the ball (translational kinetic energy) and ignored the rolling of the ball (rotational kinetic energy) in those initial experiments. Now we will derive an equation which considers both translational and rotational kinetic energy and we will see if our theory works out this time or not. We will be using two different kinds of cylinders to show the effect of moment of inertia in the velocities of the cylinders.
Different heights of a slope will be taken to examine the change in the resulting velocities of the cylinders rolling on them by analysing through video capture.
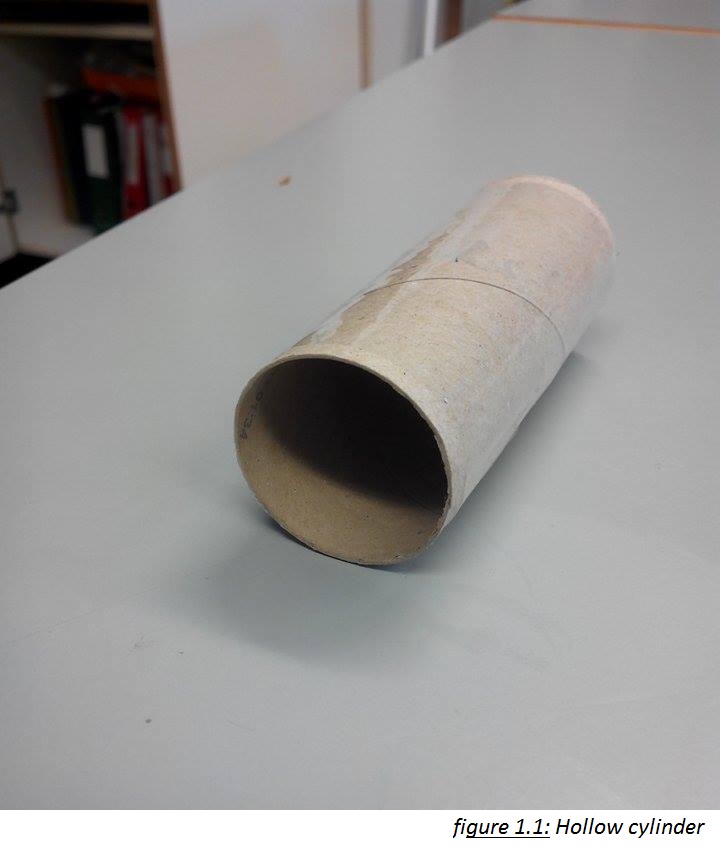
The hollow cylinder is made by using a toilet paper roll taped to ensure a smoother motion while the solid cylinder is made by stuffing another toilet paper roll by modeling clay and then taping it as well for a smoother motion along the slope (see figure 1.1 and 1.2). The aim of the experiment is to see how the height can affect the velocities of these cylinders (keeping moment of inertia and rotational kinetic energy in account while examining) and comparing it to the theoretical equation modeled for the experiment.

RESEARCH QUESTION:
“What is the relation between the height of the slope and the final velocity of the cylinder rolling down it and how the difference in the moment of inertia of the two cylinders affect their final velocities?”
VARIABLES:
Independant: Height of the slope (h)
Dependant: Final velocity of the cylinders (v)
Controlled: 1. Diameter of the cylinder
2. Length of the cylinders
3. Angle of the slope
4. Nature of the slope and surface after the slope
5. Types of cylinders
THEORY:
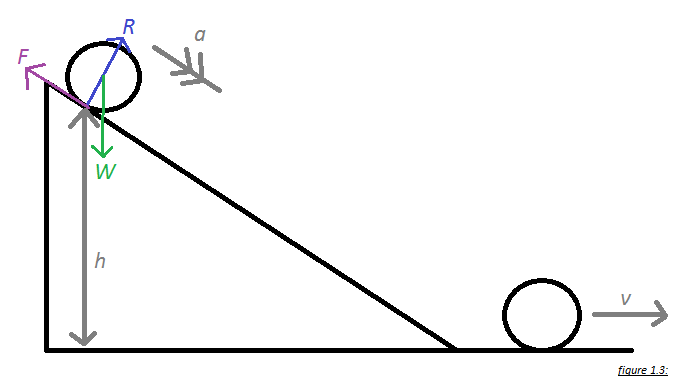
When the cylinder is released on the slope, there are forces acting on the cylinder (see figure 1.3). The normal reaction (R) and the weight (W) act through the centre of the mass. However, the frictional force (F) does not and will end up causing rotation about the centre causing the cylinder to roll.
As the cylinder rolls down it loses its gravitational potential energy (P.E) and gains translational as well as rotational kinetic energy (K.E).
Let’s take ‘h’ as the height of the slope and ‘m’ as the mass of the cylinder.
As we know:
Potential Energy = Kinetic Energy
mgh = ½ mv2
Since the cylinder is rolling:
mgh = ½ mv2 + ½Iω2
ω= v/r
For the hollow cylinder:
I(i.e the moment of inertia)= mr2
Hence,
mgh = ½ mv2 + ½ (mr2)(v2/r2)
mgh = ½ mv2 + ½ mv2
mgh = mv2
gh = v2
v2/h = g
For the solid cylinder:
I(i.e the moment of inertia)= ½ mr2
Hence,
mgh = ½ mv2 + ½ (½ mr2)(v2/r2)
mgh = ½ mv2 + ¼ mv2
mgh = 3/4 mv2
gh = 3/4 v2
v2/h = 4/3 g
METHOD :
Note: The below process was performed for both (the hollow and solid) cylinders separately:
.A platform was first made by using a lab-jack and two rulers (just like figure 1.3), making an inclined plane (or a slope) for the cylinder to roll on.
.The velocity of the cylinder is measured by doing the video analysis in Logger Pro.
.The slope is set up with an initial height of 10 cm (0.1 m).
.A camera is set up to record the motion of the cylinder after the slope (Note: the area of the video capture has to be flat so that the change in the cylinder’s velocity is minimal).
.Two points are marked of a distance of 40 cm (0.4 m) after the slope on the flat surface which will help us in analysing the video and have to be within the range of the camera (the reason why we took 40 cm here was to make sure that the points come under the range of the camera).
.The cylinder is put at the top of the slope and is then released, the motion is recorded.
.After recording, we start the video analysis. The option ‘Set Scale’ is chosen and the two marked points are selected and the distance between them is set. We start the video and put points on the cylinder as it moves on the flat surface by the option ‘Add Point’. Once this is done the graph of distance over time is plotted. The gradient of this graph leads us to the resulting velocity of the cylinder.
.Five different heights of the slope are taken and the same process is repeated four times for each height. An example of the resulting graph of the video analysis for the height 10 cm (0.1 m) for the hollow cylinder is shown in figure 1.4 (ignore the minus signs as the video was captured from left to right direction).

DATA PROCESSING:
A table is made in Excel to represent the data collected. The heights are converted to meters and the uncertainty of the ruler is mentioned (i.e ±0.01 m). The velocities are put and the average velocities are calculated (figure 1.5 shows the initial data collected for the hollow cylinder):

Our theory suggest that we have to plot the graph of v2 over h, hence we need to calculate v2 and the uncertainty of v2 by the formula (Max-Min)/2 . This is done by using the formulas in Excel.
After all the calculations the table for the hollow cylinder looked like:

And the one for the solid cylinder:

DATA PRESENTATION:
After getting the measurements and uncertainties, we plot the v2 vs h graph to see the relation between them. The gradient of the graph would help us in calculating the gravity as well. Relevant headers are added and uncertainties are also mentioned by selecting error constant ±0.01 for height and creating a ‘new manual column’ and pasting the values from Excel for the uncertainties in velocity. The steepest and least steepest lines are also placed to find the uncertainty in the gradient. Figure 1.8 and Figure 1.9 show the graph for the hollow cylinder and solid cylinder respectively:

The gradient of the best fit line = 7.170 ms-2
The gradient of the steepest line = 10.20 ms-2
The gradient of the least steep line = 6.600 ms-2
Uncertainty of the gradient = (10.2-6.6)/2 = 1.8
Hence, gradient = 7.17 ±1.8 ms-2
As the best fit line passes through all the error bars, we can say that the relation between v2 and h is linear.
According to the equation we derived, v2/h = g. This means that the gradient in this case will be the value of g which is 7.17 ±1.8 ms-2. This is close to the actual the accepted value of g (i.e 9.8 ms-2).
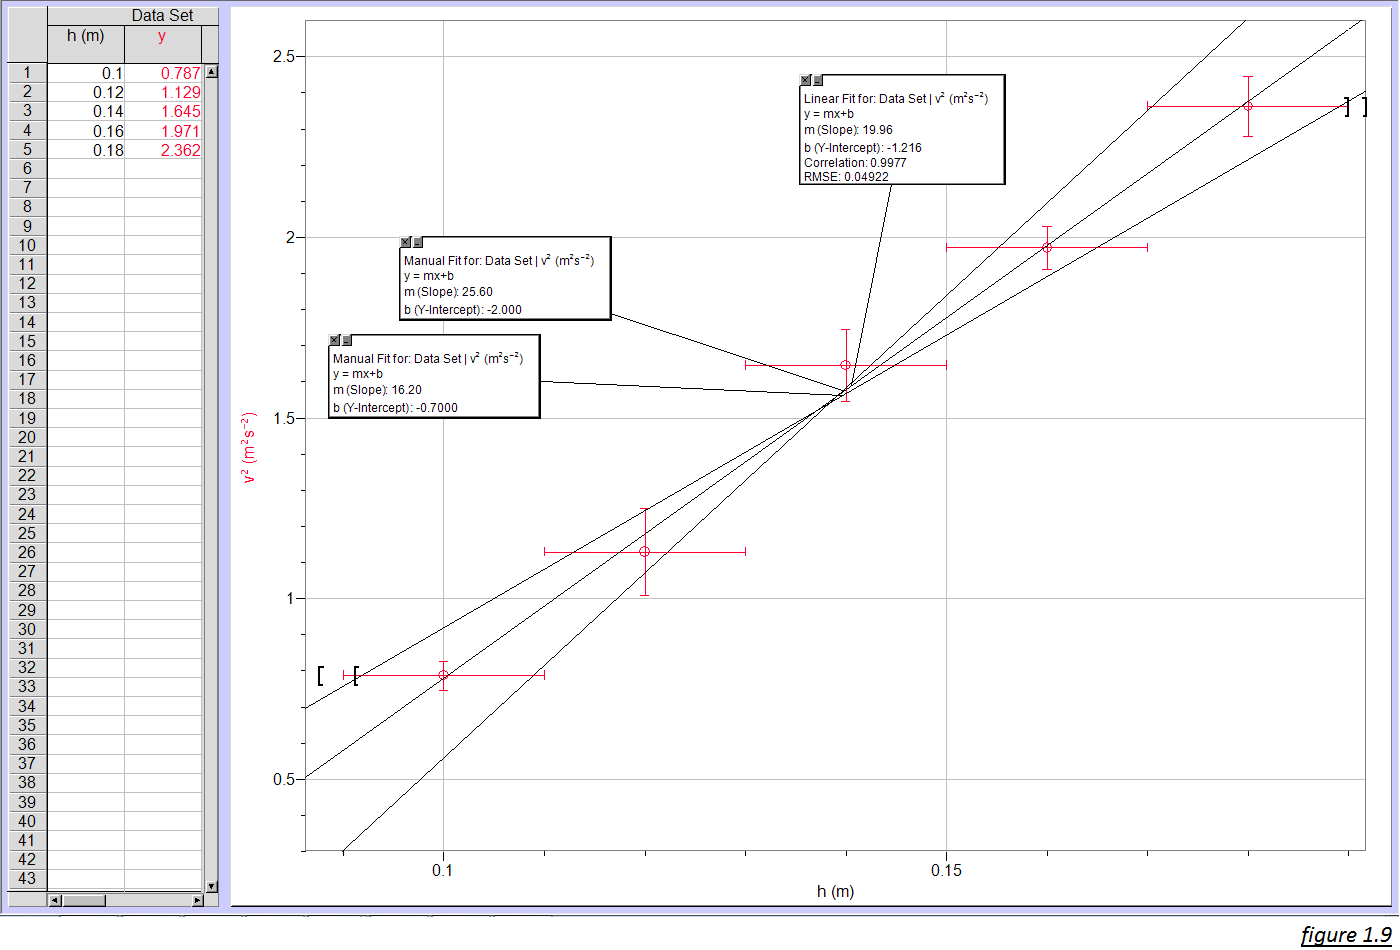
The gradient of the best fit line = 19.95 ms-2
The gradient of the steepest line = 25.60 ms-2
The gradient of the least steep line = 16.20 ms-2
Uncertainty of the gradient = (25.60-16.20)/2 = 4.7
Hence, gradient = 19.95 ±4.7 ms-2
Just like the previous graph, the best fit line passes through all the error bars in this graph as well showing that v2 and h have a linear relation.
According to the equation we derived, v2/h = 4/3 g
As the gradient is 19.95 ±4.7 ms-2
Hence,
4/3 g = 19.95 ±4.7 ms-2
g = ((19.95 ±4.7 ms-2)*3)/4
g = 14.96 ±3.5 ms-2
This is not that close (as compared to the one of the hollow cylinder) to the accepted value of g (i.e 9.8 ms-2).
CONCLUSION AND EVALUATION:
Our graphs proved that the relation between the height of the slope and the final velocity (squared) of the cylinder rolling on it is linear and by seeing the average velocities we can see that the cylinder with the greater moment of inertia (solid) goes with a faster velocity than the one with lesser moment of inertia (hollow). Our initial theory about the hollow cylinder was backed up by the graph as the gradient gave us a very close value of gravity. However, our second theory about the solid cylinder couldn’t be proved right as the gradient led to a very high value of gravity.
We will now consider the factor of air resistance on our cylinders and make a simulation in algodoo to see how their velocities vary with and without air resistance.
A simulation was then made having a hollow and a solid cylinder of (equal radius) rolling down a slope raised to the height 18 cm (0.18 m). Figure 2.0 and 2.1 show the simulations for the solid cylinder and hollow cylinder (with air resistance on) respectively:


The readings that we got from these simulations led us to the value of gravity ( 8.04 ms-2 for solid and 6.72 ms-2 for hollow cylinder).
We then turned off the air resistance to see the difference in the velocities of the cylinders:

The values of g that we got without air resistance were 8.19ms-2 and 7.62 ms-2 for solid and hollow cylinder respectively. This shows that air resistance have had an influence on both the cylinders as they rolled down the slope and on the flat part but it must have had a greater influence on the hollow cylinder (as seen by the change from 6.72 ms-2 to 7.62 ms-2) and this could be the reason why we have a smaller value of g for the hollow cylinder (in our experiment) with respect to the real value of g.
This, however, still doesn’t explain the strange high value of g for the solid cylinder gained from our experiment.
The formation of the solid cylinder in the very beginning was not that perfect and though it looked like a ‘solid’ cylinder, it wouldn’t have been perfectly solid because of formation of lumps inside or uneven filling of the modeling clay in the toilet paper roll. So the moment of inertia (that we used in our theory) might not have been fit for the solid toilet paper roll cylinder made by us.
On the other hand, if we only consider the ‘translational kinetic energy” (i.e ½ mv2) then:
mgh = ½ mv2
gh = ½ v2
v2/h = 2g
So according to the information in figure 1.9:
gradient = 19.95 ± 4.7 ms-2
2g = 19.95 ± 4.7 ms-2
g = (19.95 ± 4.7)/2
g = 9.975 ± 2.4 ms-2
This is close to the actual value of g (i.e 9.8 ms-2). So this can be hypothesized that our cylinder was sliding down the slope a lot more than rolling down the slope (which is very unlikely to happen).
The poor quality of the video in the video analysis was also a big hurdle as it affected the precision in the readings while marking the dots in the video. A better camera with more frames per second would have helped in getting more precise readings.
The main motive for this experiment was to improve our previous experiment (done in our first term-discussed in the introduction) and as we saw our self improving our initial theory, we saw new questions forming in this experiments. These questions of our cylinder slipping or rolling or about the value of moment of inertia exactly fitting or not fitting for our modeling clay cylinder can be used as a platform for further investigations and experiments.
As the Irish playwright George Barnard Stewart said:
“Science never solves a problem without creating ten more”
REFERENCES:
. http://www.student.thinkib.net/physics
. Pearson IB Physics-Chris Hamper (Page # 432-434)