Box plots - why?
 How and why do we arrange numbers?
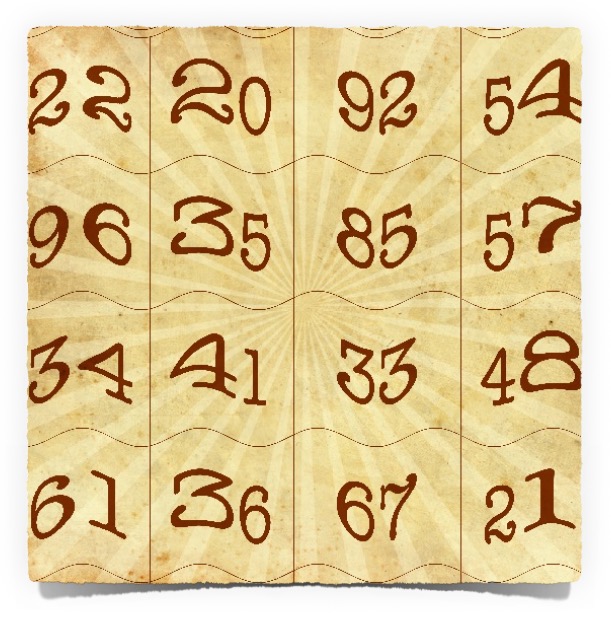
What is in a bunch of numbers? What stories do the numbers tell? It all depends on the way we look at them! Probably, we all have different instincts about what we might do with a given group of numbers. In this activity you are going to be asked to demonstrate and build on each others instincts. The task starts very simply - you will be given a set of numbers and asked to 'Arrange them' so that they tell their story?
Aims
- To explore and understand the purpose of visual data representation and, in particular, box plots for showing dispersion.
- To reflect on the key features of data set and their role in telling the story of the data
- To demonstrate the value of box plots is multiplied by making comparisons.
Teachers will want to read these ![]() Box plots Teachers notes before working with this activity. It is a great activity with lots of discussion, thinking, reflecting and learning. It is not heavy on preparation other than a bit of thought from the teacher, so I recommend reading it.
Box plots Teachers notes before working with this activity. It is a great activity with lots of discussion, thinking, reflecting and learning. It is not heavy on preparation other than a bit of thought from the teacher, so I recommend reading it.
Instructions and Resources
The data and the instructions can be printed on this ![]() Arranging data activity sheet which is also embedded below (PDF). The task is fairly straight forward!
Arranging data activity sheet which is also embedded below (PDF). The task is fairly straight forward!
In case you missed it, there is a lot more written about this activity for teachers on the Box plots - teachers notes page.